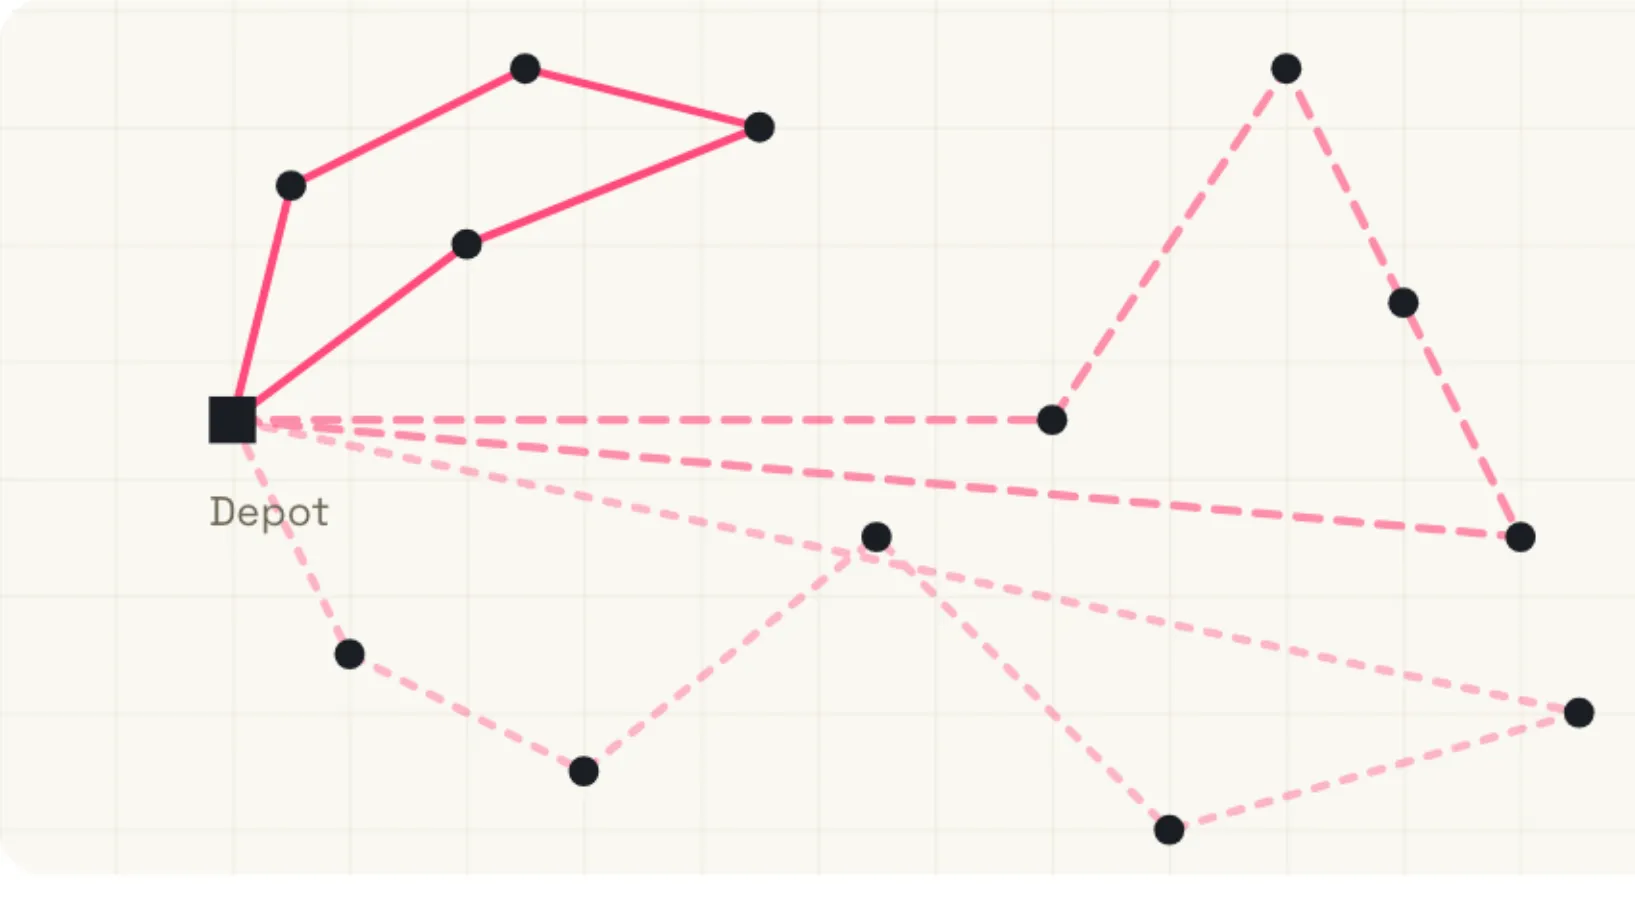
Monday, eight a.m. A supervisor opens their inbox: one technician has called in sick, a customer in town has pushed their visit back an hour, and an overnight fault report is waiting. A fix turns up, but it takes thirty minutes to an hour — and the same thing repeats several times a week.
We’ve published a new whitepaper on where this recurring friction actually comes from, and what to do about it. Field work, reallocated brings together three test optimizations from maintenance and cleaning companies, walks through one of them step by step, and gives you an ROI model to size your own potential.
The main argument: better use of capacity, not shorter routes
The value of optimization comes from better use of capacity, not simply from shorter routes.
In field service, the typical challenge is not that the route is too long. It is that the same amount of work could be done with fewer resources if it were allocated better across workers, areas and time slots. The whitepaper breaks this into three value mechanisms: shorter travel time through geographic grouping, workload balancing between overload and underutilization, and a rise in billable time as travel and waiting time are replaced with productive work.
Measured results from three customer examples
Every figure is the result of a test optimization run against the same set of tasks and the same observation period as the original plan — not a generic percentage promise.
Maintenance company A (8 stops/day, a predictable weekly plan): kilometers driven fell from 11,631 to 8,010 (−31%), driving hours from 270 to 190 (−30%), and the number of working days from 236 to 168 (−29%). Grouping by area removed the overlapping movement.
Maintenance company B (6 stops/day, a dense urban environment): kilometers driven fell from 12,909 to 9,214 (−29%), and the longest single route from 363 km to 207 km (−43%). In a dense environment, a single change in visit order compounds: small reductions in travel add up to large savings.
Cleaning company C — 13 cleaners in the capital region, 5 stops/day — is the whitepaper’s deep case. Starting point: a 76% billable share and 60 hours a month of unused working time, created by travel and waiting. Automatic work allocation, accounting for skill areas, time windows and travel-time estimates, changed the picture like this:
| Metric | Current | Optimized | Change |
|---|---|---|---|
| Capacity required | 13 shifts | 11 shifts | −2 shifts |
| Working time used | 463 h | 392 h | −15% |
| Billable share | 76% | 90% | +14 pp |
| Unused working time | 60 h | 0 h | −60 h |
| Driving hours | 27 h | 15 h | −44% |
| Kilometers driven | 838 km | 453 km | −46% |
The freed-up capacity is equivalent to roughly two field workers’ worth of work a month — without hiring — and travel costs fell by €770 a month. The optimized day isn’t shorter, it’s more productive: travel and waiting time have been replaced with billable work, without relying on increased pressure on individual field workers.
What else you’ll find in the whitepaper
Beyond the three customer examples, the whitepaper walks through four mechanisms of hidden inefficiency behind the current state, a four-level maturity model to guide adoption (manual → standardization → optimization → continuous learning), four realistic warnings about when optimization doesn’t deliver full value, and an ROI model for estimating your own organization’s potential across three components: fewer kilometers, fewer driving hours, and more billable time.
Who this whitepaper is for
Operations leadership and service managers in four industries where this mechanism is most typical: maintenance, installation, property services and mobile home care. If the Monday-morning scene above sounds familiar, the whitepaper will help you work out whether your organization has measurable optimization potential — and how to calculate it with your own data.
